5-Min First Candle Breakout/BreakdownAwesome! Here's a basic Pine Script (v5) for a First 5-minute candle breakout/breakdown strategy with Buy/Sell signals and price labels. This script works by capturing the high and low of the first candle of the session and then showing signals when those levels are broken.
You can customize it further for Entry, Stop Loss, Target, etc., but this gives you the foundation with labels for buys/sells based on breakout/breakdown.
Cerca negli script per "Buy sell"

Dual RSI SmootherUltimator's Dual RSI Smoother
Description:
The Dual RSI Smoother is a momentum-based indicator that applies two smoothed and amplified RSI calculations to analyze potential trend reversals and overbought/oversold conditions. By utilizing two separate RSI lengths and smoothing parameters, this tool provides a refined view of price momentum and potential trading signals.
Features:
Dual RSI Calculation – Computes two RSI values with separate user-defined lengths.
Smoothing & Amplification – Applies SMA-based smoothing and an amplification factor to enhance signal clarity.
Dynamic Line Colors – Adjusts colors based on RSI interactions to visually highlight important conditions.
Buy & Sell Signals – Displays buy dots when oversold conditions are detected and sell dots in overbought zones.
How to Use:
Buy Signals: Green dots appear when RSI conditions indicate an oversold market, suggesting a potential buying opportunity.
Sell Signals: Red dots appear when RSI conditions indicate an overbought market, suggesting a potential selling opportunity.
Trend Confirmation: The indicator’s smoothed RSI lines can help identify sustained trends when they diverge or cross.
User Inputs:
RSI Length 1 & 2: Adjusts the calculation periods for the two RSI values.
Line Colors: Customizable colors for fast and slow RSI lines.
Highlight Colors: Custom color for buy signal highlights.
Buy & Sell Dot Colors: Customizable colors for buy and sell signal markers.
Best Use Cases:
Identifying early reversals in overbought/oversold market conditions.
Confirming trend strength through smoothed RSI interactions.
Enhancing trade entries by aligning buy/sell signals with other momentum indicators.

BBVOL SwiftEdgeBBVOL SwiftEdge – Precision Scalping with Volume and Trend Filtering
Optimized for scalping and short-term trading on fast-moving markets (e.g., 1-minute charts), BBVOL SwiftEdge combines Bollinger Bands, Heikin Ashi smoothing, volume momentum, and EMA trend alignment to deliver actionable buy/sell signals with visual trend cues. Ideal for forex, crypto, and stocks.
What Makes BBVOL SwiftEdge Unique?
Unlike traditional Bollinger Bands scripts that focus solely on price volatility, BBVOL SwiftEdge enhances signal precision by:
Using Heikin Ashi to filter out noise and confirm trend direction, reducing false signals in choppy markets.
Incorporating volume analysis to ensure signals align with significant buying or selling pressure (customizable thresholds).
Adding an EMA overlay to keep trades in sync with the short-term trend.
Coloring candlesticks (green for bullish, red for bearish, purple for consolidation) to visually highlight market conditions at a glance.
How Does It Work?
Buy Signal: Triggers when price crosses above the lower Bollinger Band, Heikin Ashi shows bullish momentum (close > open), buy volume exceeds your set threshold (default 30%), and price is above the EMA. A green triangle appears below the candle.
Sell Signal: Triggers when price crosses below the upper Bollinger Band, Heikin Ashi turns bearish (close < open), sell volume exceeds the threshold (default 30%), and price is below the EMA. A red triangle appears above the candle.
Trend Visualization: Candles turn green when price is significantly above the Bollinger Bands’ basis (indicating a bullish trend), red when below (bearish trend), or purple when near the basis (consolidation), based on a customizable threshold (default 10% of BB width).
Risk Management: Each signal calculates a stop-loss (10% beyond the opposite band) and take-profit (opposite band), plotted for reference.
How to Use It
Timeframe: Best on 1-minute to 5-minute charts for scalping; test higher timeframes for swing trading.
Markets: Works well in volatile markets like forex pairs (e.g., EUR/USD), crypto (e.g., BTC/USD), or liquid stocks.
Customization: Adjust Bollinger Bands length (default 10), multiplier (default 1.2), volume thresholds (default 30%), EMA length (default 3), and consolidation threshold (default 0.1%) to match your strategy.
Interpretation: Look for green/red triangles as entry signals, confirmed by candle colors. Purple candles suggest caution—wait for a breakout. Use stop-loss/take-profit levels for trade management.
Underlying Concepts
Bollinger Bands: Measures volatility and identifies overbought/oversold zones.
Heikin Ashi: Smooths price action to emphasize trend direction.
Volume Momentum: Calculates cumulative buy/sell volume percentages to confirm market strength (e.g., buyVolPercent = buyVolume / totalVolume * 100).
EMA: A fast-moving average (default length 3) ensures signals align with the immediate trend.
Chart Setup
The chart displays Bollinger Bands (orange), Heikin Ashi close (green circles), EMA (purple), and volume-scaled lines (lime/red). Signals are marked with triangles, and candle colors reflect trend state. Keep the chart clean by focusing on these outputs for clarity.

RG - Volume Spike DetectorRG - Volume Spike Detector is a comprehensive volume analysis tool designed to help traders identify significant volume activity across different tickers on TradingView. This indicator not only detects overall volume spikes and percentage changes but also approximates and analyzes buying and selling volume separately, providing valuable insights into market dynamics. With customizable parameters, visual cues, and built-in alerts, it's suitable for traders of all levels looking to monitor volume-based market movements.
Features
Volume Spike Detection:
Identifies when total volume exceeds a user-defined multiple of its moving average (default: 2x).
Separate detection for buying and selling volume spikes based on their respective moving averages.
Volume Change Analysis:
Calculates and displays the percentage change in total volume from the previous bar.
Highlights significant increases (>50%) or decreases (<-50%) with alert options.
Buy/Sell Volume Approximation:
Estimates buying and selling volume using price movement and range:
Up bars: Buying volume ≈ volume * (close - low)/(high - low)
Down bars: Selling volume ≈ volume * (close - low)/(high - low)
Handles edge cases (e.g., high = low) to ensure accurate calculations.
Ideal For
Day traders monitoring sudden volume surges
Swing traders analyzing volume trends
Market analysts studying buying vs. selling pressure
This indicator empowers traders with a robust tool to track volume dynamics, offering both visual clarity and actionable alerts for informed decision-making.

Volume Delta Imbalance Index [PhenLabs]📊 Volume Delta Imbalance Index (VDII)
Version: PineScript™ v6
Description
The Volume Delta Imbalance Index is an advanced technical analysis tool that combines volume profile analysis with price movement dynamics to identify significant market imbalances. It features a sophisticated analysis system that weighs recent versus historical volume delta imbalance patterns, providing traders with insights into potential market reversals and trend continuation scenarios.
Points of Innovation:
Custom volume delta calculation incorporating price and volume relationships
Adaptive smoothing system based on market volatility
Multi-component analysis combining flow, acceleration, and strength metrics
Real-time volume profile integration with historical context
🔧 Core Components
Volume Profile Analysis: Dynamic volume delta imbalance distribution assessment
Flow Imbalance Detection: Buy/sell pressure evaluation
Strength Analysis: Composite market strength measurement
Acceleration Framework: Volume movement dynamics
Statistical Bands: Adaptive threshold system
🚨 Key Features 🚨
The indicator provides comprehensive analysis through:
Volume Delta: Up to date volume imbalance measurement
Market Structure: Support/resistance level identification
Flow Analysis: Buy/sell pressure visualization
Acceleration Signals: Movement momentum detection
Adaptive Bands: Dynamic overbought/oversold levels
📈 Visualization
Color-coded Columns: Shows direction and strength of imbalance
Signal Lines: Strong buy/sell level indicators
Statistical Bands: Shows normal trading ranges
Gradient Fills: Indicates extreme market conditions
Dynamic Opacity: Reflects trend strength
📌 Usage Guidelines
The indicator offers several customization options:
Basic Settings:
Lookback Period: Analysis timeframe adjustment
Sensitivity Level: Signal response calibration
History Depth: Historical context range
Memory Setting: Recent vs. historical data weight
Visual Settings:
Color Scheme: Bullish/bearish signal colors
Signal Levels: Strong buy/sell thresholds
Band Display: Statistical range visualization
✅ Best Use Cases / Things To Look For:
Wait for establishment in the initial trend when the VDII comes back towards zero and the color of the volume becomes more faint
Once this is established and the VDII pushes through to the other side look for small retracements above the zero line on the VDII leading you to believe it is a likely area for price to retrace and continue in its prior direction
Make sure you see the volume bars become more faint in color to give yo further confluence price will continue in its priorly established direction
⚠️ Limitations
Requires sufficient volume data
Most effective in liquid markets
Historical depth affects calculation speed
Possible lag in highly volatile conditions
What Makes This Unique
Composite Volume Analysis: Combines multiple volume metrics
Adaptive Calculation: Adjusts to market volatility
Profile Integration: Incorporates volume profile analysis
Multi-component Scoring: Weighted analysis system
Memory-efficient Design: Optimized for real-time analysis
🔧 How It Works
The indicator processes market data through four main components:
1. Volume Profile Analysis:
Creates dynamic volume delta distribution profiles
Weights recent versus historical data
Identifies significant price levels
2. Flow Imbalance Detection:
Analyzes buying versus selling pressure
Calculates normalized flow ratios
Determines market bias
3. Strength Analysis:
Measures composite market strength
Incorporates volume-weighted movements
Provides trend strength indication
4. Final Score Calculation:
Combines all components with weighted importance
Applies volatility-based smoothing
Generates final signal output
5. VDII Potential Reversal Confluences
Bars between signal confluence is default set to 10 but you can change it to whatever you’d prefer
Signals are a compiled look at the indicator as a whole determining where it think reversals or retracements are likely
💡 Note:
The indicator performs best in markets with consistent volume and clear trending or ranging conditions. Its sophisticated volume analysis provides valuable insights into market dynamics beyond traditional price-based indicators.

SatoshiSteps Swing StrategyCore Components:
The indicator combines three popular technical analysis tools:
Ichimoku Cloud: This helps identify the trend, support, and resistance levels.
RSI (Relative Strength Index): This momentum oscillator identifies overbought and oversold conditions.
MACD (Moving Average Convergence Divergence): This trend-following momentum indicator shows the relationship between two moving averages1 of prices.
Logic:
The strategy aims to identify potential swing trading opportunities by combining signals from these three components. It essentially looks for:
Trend Confirmation (Ichimoku):
Price should be above the Ichimoku cloud for buy signals.
Price should be below the Ichimoku cloud for sell signals.
The Tenkan-sen (conversion line) should cross above the Kijun-sen (base line) for buy signals.
The Tenkan-sen should cross below the Kijun-sen for sell signals.
Overbought/Oversold Conditions (RSI):
RSI should be below the overbought level for buy signals (avoiding buying when the market is potentially overextended).
RSI should be above the oversold level for sell signals (avoiding selling when the market is potentially oversold).
Momentum Confirmation (MACD):
The MACD line should be above the signal line for buy signals (indicating upward momentum).
The MACD line should be below the signal line for sell signals (indicating downward momentum).
Buy Signal:
A buy signal is generated when all the following conditions are met:
The Tenkan-sen crosses above the Kijun-sen.
The price is above both the Senkou Span A and Senkou Span B (the cloud).
The RSI is below the overbought level.
The MACD line is above the signal line.
Sell Signal:
A sell signal is generated when all the following conditions are met:
The Tenkan-sen crosses below the Kijun-sen.
The price is below both the Senkou Span A and Senkou Span B (the cloud).
The RSI is above the oversold level.
The MACD line is below the signal line.
Key Considerations:
Time Frame: The indicator has built-in adjustments for 1-hour and 4-hour timeframes, optimizing the parameters for each.
Customization: You can customize the overbought/oversold RSI levels and the styles of the buy/sell signals (triangle, label, arrow, circle) through the indicator's settings.
Accuracy: While the strategy combines multiple indicators to improve accuracy, remember that no trading indicator is perfect. Market conditions can change rapidly, and false signals can occur.
Risk Management: Always use proper risk management techniques, such as stop-loss orders, and never risk more than you can afford to lose.

RoGr75 Adaptive EMA CrossDescription:
The RoGr75 Adaptive EMA Cross indicator dynamically combines exponential moving averages (EMAs) with ATR-based volatility buffers to generate buy and sell signals across multiple timeframes. This script uses customizable settings for short and long EMAs, ATR, and volume filters, ensuring that signals are both volatility-adjusted and timeframe-aware. It includes features such as adaptive buffers, distinct price level filters for buying and selling, and a reset mechanism to prevent redundant signals. Additionally, the indicator manages signal labels efficiently to keep your chart uncluttered.
Warning:
This script is provided for testing and educational purposes only. It is not intended as financial advice, and past performance does not guarantee future results. Use at your own risk. Always conduct your own research before making any trading decisions.
Higher Timeframe Input: Choose a specific timeframe for the indicator’s calculations; leave blank to use the chart’s current timeframe.
Signal Distance: Sets the distance of signal labels from the candles as a multiple of the ATR.
Exact Value Offset: Adjusts the secondary marker’s position for precision on the chart.
ATR Length: Defines the period used to calculate the Average True Range for volatility measurement.
EMA Lengths: Specify the periods for the short and long exponential moving averages.
Buy/Sell Buffer ATR Multipliers: Dynamically adjust the trigger distance beyond the EMA crossovers based on volatility.
Price Level Filter: Activates a filter so that buy signals only occur above a set price and sell signals only occur below that price (0 disables the filter).
Volume Filter: Optionally requires current volume to exceed a set multiple of a 20-period average for signal confirmation.
Reset Period: Resets the last signal memory after a specified number of bars to avoid suppressing valid repeat signals.
EMA Colors & Line Width: Customize the appearance of the short and long EMAs.
Label Colors & Styles: Choose colors, text colors, and styles for the buy and sell signal labels.
Background Highlighting: Optionally colors the background when a buy or sell signal occurs.
Label Management: Automatically removes the oldest labels when a set maximum is reached to keep the chart clean.
Alerts: Predefined conditions allow you to set TradingView alerts when buy or sell signals are generated.
Warning: This indicator is for testing purposes only and is not financial advice. Use it at your own risk.

Reversal rehersal v1This indicator was designed to identify potential market reversal zones using a combination of RSI thresholds (shooting range/falling range), candlestick patterns, and Fair Value Gaps (FVGs). By combining all these elements into one indicator, it allow for outputting high probability buy/sell signals for use by scalpers on low timeframes like 1-15 mins, for quick but small profits.
Note: that this has been mainly tested on DE40 index on the 1 min timeframe, and need to be adjusted to whichever timeframe and symbol you intend to use. Refer to the backtester feature for checking if this indicator may work for you.
The indicator use RSI ranges from two timeframes to highlight where momentum is building up. During these areas, it will look for certain candlestick patterns (Sweeps as the primary one) and check for existance of fair value gaps to further enhance the hitrate of the signal.
The logic for FVG detection was based on ©pmk07's work with MTF FVG tiny indicator. Several major changes was implemented though and incorporated into this indicator. Among these are:
Automatically adjustments of FVG boxes when mitigated partially and options to extend/cull boxes for performance and clarity.
Backtesting Table (Experimental):
This indicator also features an optional simplified table to review historical theoretical performance of signals, including win rate, profit/loss, and trade statistics. This does not take commision or slippage into consideration.
Usage Notes:
Setup:
1. Add the indicator to your chart.
2. Decide if you want to use Long or Short (or both).
3. If you're scalping on ie. 1 min time frame, make sure to set FVG's to higher timeframes (ie. 5, 15, 60).
4. Enable the 'Show backtest results' and adjust the 'Signals' og 'Take profit' and 'Stop loss' values until you are satisfied with the results.
Use:
1. Setup an alert based on either of the 'BullishShooting range' or 'BearishFalling range' alerts. This will draw your attention to watch for the possible setups.
2. Verify if there's a significant imbalance prior to the signal before taking the trade. Otherwise this may invalidate the setup.
3. Once a signal is shown on the graph (either Green arrow up for buys/Red arrow down for sells) - you should enter a trade with the given 'Take profit' and 'Stop loss' values.
4. (optional) Setup an alert for either the Strong/Weak signals. Which corresponds to when one of the arrows are printed.
Important: This is the way I use it myself, but use at own risk and remember to combine with other indicators for further confluence. Remember this is no crystal ball and I do not guarantee profitable results. The indicator merely show signals with high probability setups for scalping.

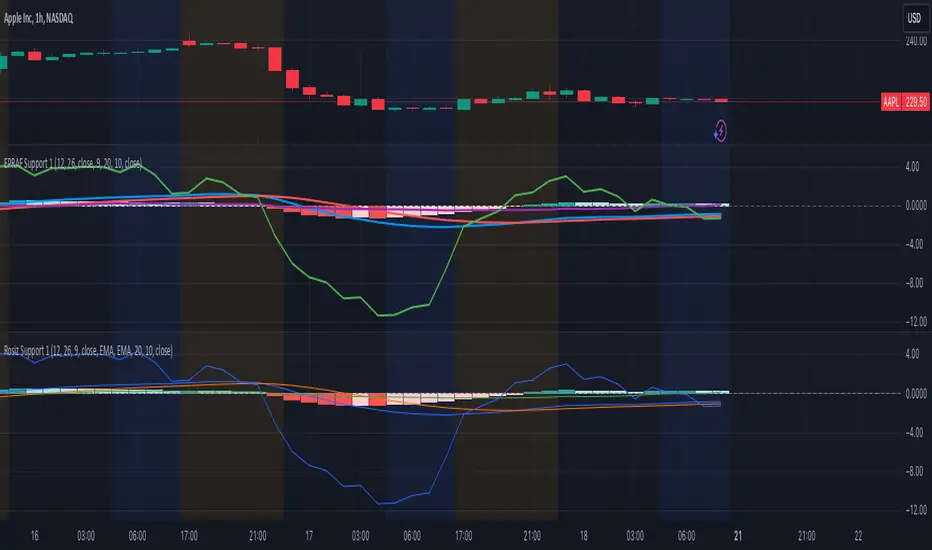
Rosiz Support 1### Description of the Custom Indicator: MACD + CMF + MOM
This custom indicator combines three powerful technical analysis tools: **MACD (Moving Average Convergence Divergence)**, **CMF (Chaikin Money Flow)**, and **MOM (Momentum)**, to provide a comprehensive view of market trends, momentum, and money flow in a single pane. Here's what each component offers:
---
#### 1. **MACD (Moving Average Convergence Divergence)**
The **MACD** is a trend-following momentum indicator that shows the relationship between two moving averages of an asset’s price.
- **Purpose**: Identifies trend direction and momentum strength.
- **Key Components**:
- **MACD Line**: Difference between the fast and slow exponential moving averages (EMA).
- **Signal Line**: A smoothed moving average of the MACD line, acting as a trigger for buy/sell signals.
- **Histogram**: The difference between the MACD line and the signal line. Positive values indicate bullish momentum, while negative values indicate bearish momentum.
- **Usage**: Look for crossovers (MACD crossing the signal line) to identify potential trend changes.
---
#### 2. **CMF (Chaikin Money Flow)**
The **CMF** measures the volume-weighted average of accumulation and distribution over a specific period. It shows whether money is flowing into or out of an asset.
- **Purpose**: Detects buying or selling pressure based on price and volume.
- **Key Components**:
- **Positive CMF**: Indicates that the asset is being accumulated (buying pressure).
- **Negative CMF**: Indicates that the asset is being distributed (selling pressure).
- **Usage**: Values above 0 suggest bullish strength, while values below 0 suggest bearish strength.
---
#### 3. **MOM (Momentum)**
The **Momentum Indicator** measures the rate of change of an asset's price over a specified period. It helps traders identify the speed of price movements.
- **Purpose**: Highlights the strength and direction of price momentum.
- **Key Components**:
- **Momentum Line**: Positive values indicate upward momentum, while negative values indicate downward momentum.
- **Usage**: A rising momentum line suggests strengthening price trends, while a falling line indicates weakening trends.
---
### Benefits of Combining These Indicators:
1. **Trend Confirmation**: MACD provides a clear picture of trend direction and potential reversals.
2. **Volume-Based Insights**: CMF adds a layer of confirmation by analyzing money flow based on price and volume.
3. **Momentum Analysis**: MOM reveals the speed and strength of price movements, helping traders confirm breakouts or trend exhaustion.
4. **Enhanced Decision-Making**: The combination of these indicators allows traders to make more informed decisions by evaluating different aspects of market behavior in one pane.
---
### How to Use:
- **Identify Trends**: Use MACD to identify overall trend direction and reversals.
- **Confirm Momentum**: Check MOM to validate the strength of the trend.
- **Gauge Buying/Selling Pressure**: Refer to CMF to confirm whether the price movement is backed by accumulation or distribution.
- **Entry/Exit Points**: Look for MACD crossovers, CMF shifts above/below zero, and momentum changes to refine entry and exit strategies.
This powerful tool integrates the strengths of three indicators, making it ideal for traders looking to analyze market conditions holistically and improve their timing and accuracy.
Volume EquilibriumThe intent behind this indicator is to provide comprehensive information relating to volume compared to multiple timeframes. This indicator allows one to see what the market 'theoretically' sees as 'fair-value' whilst also allowing one to gauge where the price of a stock is headed.
Volume Equilibrium
The main indicator finds the difference between buying volume and selling volume, under the basic presumption that more buying volume indicates greater bullish sentiment and vice versa.
Buying Volume = volume when close price is higher than open price.
Selling Volume = volume when close price is lower than open price.
Volume Balance = Cumulative Buying Volume − Cumulative Selling Volume
Volume Balance is then expressed as a percentage by dividing by total volume
This indicator is composed of three different lengths of the same indicator. Short, Mid, and Long term representations of Volume Equilibrium. The difference between the mid and long term are highlighted so to make it easy to see where volume is going relative to a longer time frame.
HOW TO USE:
At 0 ---> Equilibrium ---> Equal Buying/Selling Volume
Above 0 ---> More buying Volume
Below 0 ---> More selling Volume
Using theory, it is assumed that the price is at a 'fair-value' when the buying/selling volume is at 0. This is of course relative to the respective timeframe of your choosing. More weight given to larger timeframes.
Volume Histogram
It is a basic volume chart that represents the total volume though has highlighted bars so to indicate buying(green) and selling(red) volume. This allows one to see what the indicator is based off of.
Open-Close Oscillator(not needed)
Calculates the average open-close for a selected timeframe and then provides the current closing price relative to that average open-close. Very simply put, values below 0 indicate bearish and values above 0 generally indicate bullishness. This indicator is for a quick reference of price action relative to volume.
Another way to use this indicator, though unique, is to analyze the separate open-close lines themselves. Using the open-close bands, bullishness is defined as increasing closing prices and bearish as decreasing closing prices. So, in regard to this indicator, bear sessions can be indicated by the opening line being below the closing line and bull sessions as the opening line being above. Use the 'flip' of these lines to your advantage, they are very helpful at capturing long continuous sentiment.
This indicator is composed of great information though I still think it best to use many different indicators to help you with your trades.
NOTE: Be aware of what we are trying to analyze, Volume. This means that one should also look out for divergences to capture early indications of reversals. This indicator can be leveraged greatly.

Uptrick: Arbitrage OpportunityINTRODUCTION
This script, titled Uptrick: Arbitrage Monitor, is a Pine Script™ indicator that aims to help traders quickly visualize potential arbitrage scenarios across multiple cryptocurrency exchanges. Arbitrage, in general, involves taking advantage of price differences for the same asset across different trading platforms. By comparing market prices of the same symbol on two user-selected exchanges, as well as scanning a broader list of exchanges, this script attempts to signal areas where you might want to buy on one exchange and sell on another. It includes various graphical tools, calculations, and an optional Automated Detection signal feature, allowing users to incorporate more advanced data scanning into their trading decisions. Keep in mind that transaction fees must also be considered in real-world scenarios. These fees can negate potential profits and, in some cases, result in a net loss.
PURPOSE
The primary purpose of this indicator is to show potential percentage differences between the same cryptocurrency trading pairs on two different exchanges. This difference is displayed numerically, visually as a line chart, and it is also tested against user-defined thresholds. With the threshold in place, buy and sell signals can be generated. The script allows you to quickly gauge how significant a spread is between two exchanges and whether that spread surpasses a specified threshold. This is particularly useful for arbitrage trading, where an asset is bought at a lower price on one exchange and sold at a higher price on another, capitalizing on price discrepancies. By identifying these opportunities, traders can potentially secure profits across different markets.
WHY IT WAS MADE
This script was developed to help traders who frequently look for arbitrage opportunities in the fast-paced cryptocurrency market. Cryptocurrencies sometimes experience quick price divergences across different exchanges. By having an automated approach that compares and displays prices, traders can spend less time manually tracking price discrepancies and more time focusing on actual trading strategies. The script was also made with user customization in mind, allowing you to toggle an optional Automated-based approach and choose different moving average methods to smooth out the displayed price difference.
WHAT ARBITRAGE IS
Arbitrage is the practice of buying an asset on one market (or exchange) at a lower price and simultaneously selling it on another market where the price is higher, thus profiting from the price difference. In cryptocurrency markets, these price differentials can occur across multiple exchanges due to varying liquidity, trading volume, geographic factors, or market inefficiencies. Though sometimes small, these differences can be exploited for profit when approached methodically.
EXPLANATION OF INPUTS
The script includes a variety of user inputs that help tailor the indicator to your specific needs:
1. Compared Symbol 1: This is the primary symbol you want to track (for example, BTCUSDT). Make sure it's written in all capital and make sure that it's price from that exchange is available on Tradingview.
2. Compare Exchange 1: The first exchange on which the script will request pricing data for the chosen symbol.
3. Compared to Exchange: The second exchange, used for the comparison.
4. Opportunity Threshold (%): A percentage threshold that, when exceeded by the price difference, can trigger buy or sell signals.
5. Plot Style?: Allows you to choose between plotting the raw difference line or a moving average of that difference.
6. MA Type: Select among SMA, EMA, WMA, RMA, or HMA for your moving average calculation.
7. MA Length: The lookback period for the selected moving average.
8. Plot Buy/Sell Signals?: Enables or disables the plotting of arrows signaling potential buy or sell zones based on threshold crossovers.
9. Automated Detection?: Toggles an additional multi-exchange data scan feature that calculates the highest and lowest prices for the specified symbol across a predefined list of exchanges.
CALCULATIONS
At its core, the script calculates price1 and price2 using the request.security function to fetch close prices from two selected exchanges. The difference is measured as (price1 - price2) / price2 * 100. This results in a percentage that indicates how much higher or lower price1 is relative to price2. Additionally, the script calculates a slope for this difference, which helps color the line depending on whether it is trending up or down. If you choose the moving average option, the script will replace the raw difference data with one of several moving average calculations (SMA, EMA, WMA, RMA, or HMA).
The script also includes an iterative scan of up to 15 different exchanges for Automated detection, collecting the highest and lowest price across all those exchanges. If the Automated option is enabled, it compiles a potential recommendation: buy at the cheapest exchange price and sell at the most expensive one. The difference across all exchanges (allExDiffPercent) is calculated using (highestPriceAll - lowestPriceAll) / lowestPriceAll * 100.
WHAT AUTOMATED DETECTION SIGNAL DOES
If enabled, the Automated detection feature scans all 15 supported exchanges for the specified symbol. It then identifies the exchange with the highest price and the exchange with the lowest price. The script displays a recommended action: buy on the lowest-exchange price and sell on the highest-exchange price. While called “Automated,” it is essentially a multi-exchange data query that automates a portion of research by consolidating different price points. It does not replace thorough analysis or guaranteed execution; it simply provides an overview of potential extremes.
WHAT ALL-EX-DIFF IS
The variable allExDiffPercent is used to show the overall difference between the highest price and the lowest price found among the 15 pre-chosen exchanges. This figure can be useful for anyone wanting a big-picture view of how large the arbitrage spread might be across the broader market.
SIGNALS AND HOW THEY ARE GENERATED
The script provides two main modes of signal generation:
1. Raw Difference Mode: If the user chooses “Use Normal Line,” the script compares the percentage difference of the two selected exchanges (price1 and price2) to the user-defined threshold. When the difference crosses under the positive threshold, a sell signal is displayed (red arrow). Conversely, when the difference crosses above the negative threshold, a buy signal is displayed (green arrow).
2. Moving Average Mode: If the user selects “Use Moving Average,” the script instead references the moving average values (maValue). The signals fire under similar conditions but use the average line to gauge whether the threshold has been crossed.
HOW TO USE THE INDICATOR
1. Add the script to your chart in TradingView.
2. In the script’s settings panel, configure the symbol you wish to compare (for example, BTCUSDT), choose the two exchanges you want to evaluate, and set your desired threshold.
3. Optionally, pick a moving average type and length if you prefer a smoother representation of the difference.
4. Enable or disable buy/sell signals according to your preference.
5. If you’d like to see potential extremes among a broader list of exchanges, enable Automated Detection. Keep in mind that this feature runs additional security requests, so it might slow down performance on weaker devices or if you already have many scripts running.
EXCHANGES TO USE
The script currently supports up to 15 exchanges: BYBIT, BINANCE, MEXC, BLOFIN, BITGET, OKX, KUCOIN, COINBASE, COINEX, PHEMEX, POLONIEX, GATEIO, BITSTAMP, and KRAKEN. You can choose any two of these for direct comparison, and if you enable the Automated detection, it will attempt to query them all to find extremes in real time.
VISUALS
The exchanges and current prices & differences are all plotted in the table while the colored line represents the difference in the price. The two thresholds colored red are where signals are generated. A cross below the upper threshold is a sell signal and a cross above the lower threshold is a buy signal. In the line at the bottom, purple is a negative slope and aqua is a positive slope.
LIMITATIONS AND POTENTIAL PROBLEMS
If you enable too many visual elements such as signals, additional lines, and the Automated-based scanning table, you may find that your chart becomes cluttered, or text might overlap. One workaround is to remove and reapply the indicator to refresh its display. You may also want to reduce the number of displayed table rows by disabling some features if your chart becomes too crowded. Sometimes there might be an error that the price of an asset is not available on an exchange, to fix this, go and select another exchange to compare it to, or if it happens in Automated detection, choose a different asset, ideally more widely spread.
UNIQUENESS
This indicator stands out due to its multifaceted approach: it doesn’t just look at two exchanges but optionally scans up to 15 exchanges in real time, presenting users with a much broader view of the market. The dual-mode system (raw difference vs. moving average) allows for both immediate, unfiltered signals and smoother, noise-reduced signals depending on user preference. By default, it introduces dynamic visual cues through color changes when the slope of the difference transitions upward or downward. The optional Automated detection, while not a deep learning system, adds a functional intelligence layer by collating extreme price points from multiple exchanges in one place, thereby streamlining the manual research process. This combination of features gives the script a unique edge in the TradingView ecosystem, catering equally to novices wanting a straightforward approach and to advanced users looking for an aggregated multi-exchange analysis.
CONCLUSION
Uptrick: Arbitrage Monitor is a versatile and customizable Pine Script™ indicator that highlights price differences for a specified symbol between two user-selected exchanges. Through signals, threshold-based alerts, and optional Automated detection across multiple exchanges, it aims to support traders in identifying potential arbitrage opportunities quickly and efficiently. This script makes no guarantees of profitability but can serve as a valuable tool to add to your trading toolkit. Always use caution when implementing arbitrage strategies, and be mindful of market risks, exchange fees, and latency.
ADDITIONAL DISCLOSURES
This script is provided for educational and informational purposes only. It does not constitute financial advice or a guarantee of performance. Users are encouraged to conduct thorough research and consider the inherent risks of arbitrage trading. Market conditions can change rapidly, and orders may fail to execute at desired prices, especially when large price discrepancies attract competition from other traders.

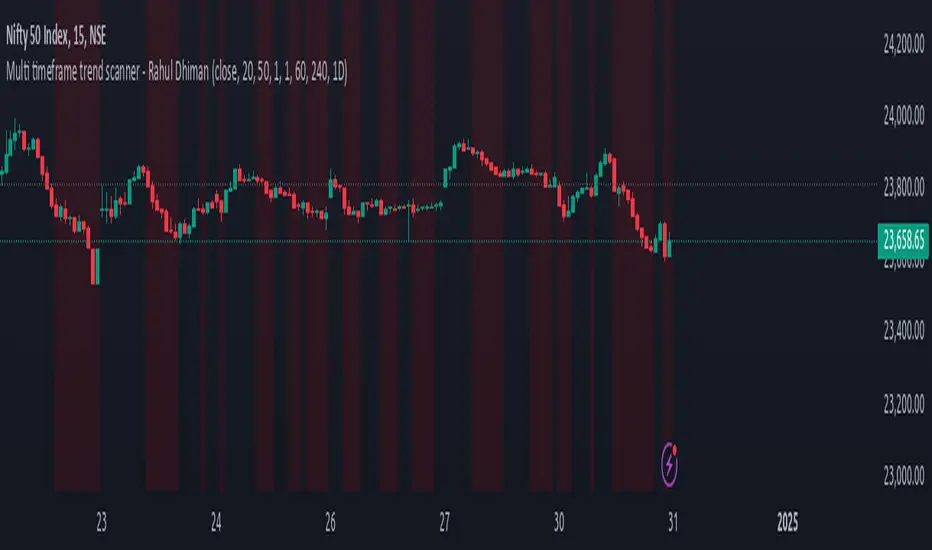
MULTI TF SCANNERMulti-Timeframe Moving Average Scanner Script
This script is designed to scan multiple timeframes for specific moving average (MA) crossovers to help traders identify potential buy or sell signals. The moving averages, such as the Simple Moving Average (SMA) or Exponential Moving Average (EMA), are calculated for different timeframes, allowing the script to provide a comprehensive analysis of the market trend.
Features:
Multiple Timeframe Analysis:
The script scans across various timeframes, including 5 minutes, 15 minutes, 1 hour, 4 hours, 1 day, and 1 week.
The moving averages are calculated for each of these timeframes, enabling the trader to gauge trends across short, medium, and long-term periods.
MA Crossover Detection:
The script checks for crossovers between a fast-moving average (e.g., 9-period) and a slow-moving average (e.g., 50-period).
A bullish crossover (fast MA crossing above slow MA) signals a potential buy, while a bearish crossover (fast MA crossing below slow MA) signals a potential sell.
Recursive Timeframe Check:
Before generating a buy or sell signal, the script checks for confirmations from higher timeframes.
Signals are only generated when the crossovers align across multiple timeframes (e.g., a buy signal on the 5-minute chart is confirmed by a bullish crossover on the 1-hour and 4-hour charts).
Signal Quality Indicator:
The script assigns a quality score to each signal based on how many higher timeframes confirm the crossover.
A stronger confirmation across multiple timeframes increases the quality of the signal, which can be visualized on the chart.
Optimized for Performance:
The calculations for moving average crossovers are designed to minimize unnecessary recalculations, optimizing the script’s performance and reducing lag.
The multi-timeframe checks are done only when the moving average crossover occurs or changes, ensuring efficiency.
User-Friendly Interface:
The results are displayed on the chart with clear visual cues to indicate the buy/sell signals and signal strength.
The script is minimalistic, with an uncluttered interface, providing the user with only the most relevant information for making trading decisions.
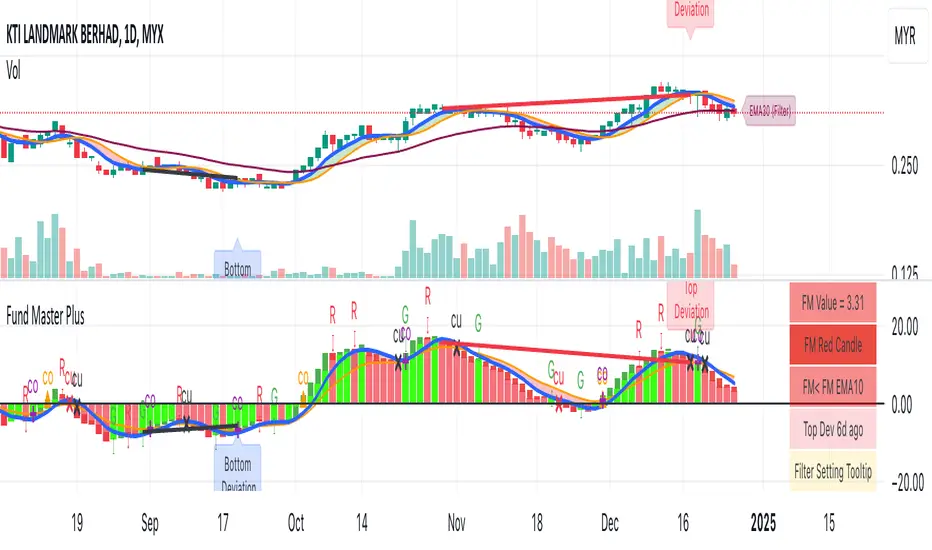
Fund Master Plus (TV Rev1, Dec2024)License: Mozilla Public License 2.0 (Open Source)
Version: Pine Script™ v6
Indicator Name: Fund Master Plus (TV Rev1, Dec2024)
Short Title: Fund Master Plus
About Fund Master Plus
Fund Master Plus indicator is an oscillating technical analysis tool designed to simulate the fund inflow and outflow trend.
Key features:
1. Fund Master Value and Candle
The candle highlights the direction of the Fund Master value.
Green candles represent an upward trend, while red candles indicate a downward trend.
When the candle crossover 0, it is a sign of the start of mid term bull, vice versa.
When the candle is above 0, it is a sign of mid-term bull, vice versa.
2. Fund Master Bar
This bar provides added visual representation of the Fund Master value.
Green bars represent and upward trend, while red bars indicate a downward trend.
3. FM EMA (Exponential Moving Average)
The Fund Master EMA (Exponential Moving Average) helps smooth out FM value fluctuations
and identify the overall trend.
When the candle crossover FM EMA, it is a sign of the start of short term bull, vice vera.
When the candle is above FM EMA, it is a sign of short term bull, vice versa.
4. EMA of FM EMA
This is an EMA of the Fund Master EMA, which can provide additional insights into the
trend's strength.
5. Candle Turn Green or Red
This feature generates alerts to signal potential trend changes.
6. Bottom Deviation & Top Deviation
Line plot and label of these deviation will show on indicator and the price chart to help user
identify potential buying and selling opportunities.
7. Alertcondition for Turn Green or Turn Red
User can set the alert using the Create Alert (the Clock Icon).
8. Table Summary
A table summary is provided to show indicator name, FM value, FM candle status,
Crossover, Crossunder, Turn Green, Turn Red status, Bar Number etc.
A tooltip for Filter Setting and a filter status check.
SOP to use the indicator:
Table (GR1):
Show Table: This option enables or disables the display of the table.
Text Size: This option allows you to set the text size for the table entries.
Width: This option sets the width of the table.
Fund Master Candle Color Setting (GR2):
FM candle will up by default.
This option enables the color setting of Fund Master candle.
Up: This option sets the color of the Fund Master candle for uptrend.
Down: This option sets the color of the Fund Master candle for downtrend.
Fund Master Bar and Color Setting (GR3):
Show Fund Master Bar: This option enables or disables the display of the Fund Master bar.
Up: This option sets the color of the Fund Master bar for uptrend.
Down: This option sets the color of the Fund Master bar for downtrend.
Fund Master EMA plots (GR4):
Show FM EMA: This option enables or disables the display of the Fund Master EMA line.
Look Back Period: This option sets the lookback period for the Fund Master EMA calculation.
EMA Color: This option sets the color of the Fund Master EMA line.
Show EMA of FM EMA: This option enables or disables the display of the EMA of the Fund Master EMA line.
Look Back Period 2: This option sets the lookback period for the EMA of the Fund Master EMA calculation.
Alerts: Fund Master Crossover & Crossunder EMA Line or 0 (GR5):
Show FM Crossover 0: This option enables or disables the display of the alert for FM crossover above the 0 line.
Show FM Crossunder 0: This option enables or disables the display of the alert for FM crossover below the 0 line.
Show FM Crossover EMA: This option enables or disables the display of the alert for FM crossover above the EMA line.
Show FM Crossunder EMA: This option enables or disables the display of the alert for FM crossover below the EMA line.
Bottom and Top Deviation (GR6):
Show Bottom Deviation: This option enables or disables the display of the bottom deviation line.
Show Top Deviation: This option enables or disables the display of the top deviation line.
Turn Green, Turn Red Alert (GR7):
Show Turn Green/Red Alerts: This option enables or disables the display of alerts for when the Fund Master value changes direction.
Current & Turn Green/Red Alerts: This option sets the number of bars to look back for the turn green/red alerts.
Band and User Input Setting (GR8):
100: This option enables or disables the display of the 100 band.
0: This option enables or disables the display of the 0 band.
-100: This option enables or disables the display of the -100 band.
User Input: This option enables or disables the display of a custom band based on user input.
Value: This option sets the value for the custom band.
Disclaimer
Attached chart is for the purpose of illustrating the use of indicator, no recommendation of buy/sell.
In this chart, all features in the setting are turned on (default and non default).
This chart is used to demonstrate the FM trend movement from mid-term bear to mid-term bull,
short-term bear and bull, bottom deviation and top deviation.
Hope this help. Merry Christmas and Happy New Year.
Bondar Drive v2.1Title: Bondar Drive v2.1 — Real-time print and delta tick volume visualization
Description:
Bondar Drive v2.1 is a tool for visualizing real-time order flow data. It highlights price movements and volume deltas in an intuitive, easy-to-read format. Indicator can be used in conjunction with the Anchored Volume Profile and Volume Footprint (Type: Total).
Features:
Real-Time Print Visualization:
Displays order flow prints with delta colors for buy/sell dominance.
Adjustable size and transparency for varying order thresholds.
Volume Delta Analysis:
Categorizes orders into Tiny, Small, Session, Large, and Huge based on user-defined thresholds.
Provides a tooltip showing order time and price.
Customizable Time Range:
Keeps prints visible for a specified duration (in seconds).
Flexible User Inputs:
Adjustable time zones, print sizes, starting bar index, and volume thresholds.
Visual Enhancements:
Line connections between prints show progression of orders and market direction.
How It Works:
The indicator gathers volume delta and price data in real time.
It dynamically displays circular labels with varying sizes and colors, reflecting the size and type of orders. Labels and lines are automatically removed after the specified time range, ensuring a clean and uncluttered chart.
Customization Options:
Number of Prints: Control how many prints are displayed.
Order Size Filters: Exclude small trades to highlight significant orders.
Color Options: Customize print colors, text, and connecting lines.
Time Offset: Adjust for your local time zone.
Use Cases:
Identify order flow imbalances and price levels dominated by buyers or sellers.
Track the progression of large orders for better trade execution.
Spot market reversals and momentum shifts using real-time prints and delta.

Force Volume GradientThis Pine Script is a technical indicator designed for trading platforms, specifically TradingView. It plots the Force Volume Gradient (FVG) and generates buy/sell signals based on the crossover of the FVG line and a signal line.
Key Components:
Force Index: Calculates the exponential moving average (EMA) of the product of the close price and volume.
Force Volume Gradient (FVG): Calculates the EMA of the Force Index.
Signal Line: A simple moving average (SMA) of the FVG.
Buy/Sell Signals: Generated when the FVG line crosses above/below the signal line.
How it Works:
The script calculates the Force Index, which measures the amount of energy or "force" behind price movements.
The FVG is then calculated by applying an EMA to the Force Index, smoothing out the values.
The signal line is a SMA of the FVG, providing a benchmark for buy/sell signals.
When the FVG line crosses above the signal line, a buy signal is generated. Conversely, when the FVG line crosses below the signal line, a sell signal is generated.
Trading Strategy:
This script can be used as a momentum indicator to identify potential buying or selling opportunities. Traders can use the buy/sell signals as entry/exit points, or combine the FVG with other indicators to create a more comprehensive trading strategy.
Customization:
Users can adjust the input parameters, such as the length of the Force Index and signal line, to suit their individual trading preferences.

Adapted RSI w/ Multi-Asset Regime Detection v1.1The relative strength index (RSI) is a momentum indicator used in technical analysis. RSI measures the speed and magnitude of an asset's recent price changes to detect overbought or oversold conditions in the price of said asset.
In addition to identifying overbought and oversold assets, the RSI can also indicate whether your desired asset may be primed for a trend reversal or a corrective pullback in price. It can signal when to buy and sell.
The RSI will oscillate between 0 and 100. Traditionally, an RSI reading of 70 or above indicates an overbought condition. A reading of 30 or below indicates an oversold condition.
The RSI is one of the most popular technical indicators. I intend to offer a fresh spin.
Adapted RSI w/ Multi-Asset Regime Detection
Our Adapted RSI makes necessary improvements to the original Relative Strength Index (RSI) by combining multi-timeframe analysis with multi-asset monitoring and providing traders with an efficient way to analyse market-wide conditions across different timeframes and assets simultaneously. The indicator automatically detects market regimes and generates clear signals based on RSI levels, presenting this data in an organised, easy-to-read format through two dynamic tables. Simplicity is key, and having access to more RSI data at any given time, allows traders to prepare more effectively, especially when trading markets that "move" together.
How we calculate the RSI
First, the RSI identifies price changes between periods, calculating gains and losses from one look-back period to the next. This look-back period averages gains and losses over 14 periods, which in this case would be 14 days, and those gains/losses are calculated based on the daily closing price. For example:
Average Gain = Sum of Gains over the past 14 days / 14
Average Loss = Sum of Losses over the past 14 days / 14
Then we calculate the Relative Strength (RS):
RS = Average Gain / Average Loss
Finally, this is converted to the RSI value:
RSI = 100 - (100 / (1 + RS))
Key Features
Our multi-timeframe RSI indicator enhances traditional technical analysis by offering synchronised Daily, Weekly, and Monthly RSI readings with automatic regime detection. The multi-asset monitoring system allows tracking of up to 10 different assets simultaneously, with pre-configured major pairs that can be customised to any asset selection. The signal generation system provides clear market guidance through automatic regime detection and a five-level signal system, all presented through a sophisticated visual interface with dynamic RSI line colouring and customisable display options.
Quick Guide to Use it
Begin by adding the indicator to your chart and configuring your preferred assets in the "Asset Comparison" settings.
Position the two information tables according to your preference.
The main table displays RSI analysis across three timeframes for your current asset, while the asset table shows a comparative analysis of all monitored assets.
Signals are colour-coded for instant recognition, with green indicating bullish conditions and red for bearish conditions. Pay special attention to regime changes and signal transitions, using multi-timeframe confluence to identify stronger signals.
How it Works (Regime Detection & Signals)
When we say 'Regime', a regime is determined by a persistent trend or in this case momentum and by leveraging this for RSI, which is a momentum oscillator, our indicator employs a relatively simple regime detection system that classifies market conditions as either Bullish (RSI > 50) or Bearish (RSI < 50). Our benchmark between a trending bullish or bearish market is equal to 50. By leveraging a simple classification system helps determine the probability of trend continuation and the weight given to various signals. Whilst we could determine a Neutral regime for consolidating markets, we have employed a 'neutral' signal generation which will be further discussed below...
Signal generation occurs across five distinct levels:
Strong Buy (RSI < 15)
Buy (RSI < 30)
Neutral (RSI 30-70)
Sell (RSI > 70)
Strong Sell (RSI > 85)
Each level represents different market conditions and probability scenarios. For instance, extreme readings (Strong Buy/Sell) indicate the highest probability of mean reversion, while neutral readings suggest equilibrium conditions where traders should focus on the overall regime bias (Bullish/Bearish momentum).
This approach offers traders a new and fresh spin on a popular and well-known tool in technical analysis, allowing traders to make better and more informed decisions from the well presented information across multiple assets and timeframes. Experienced and beginner traders alike, I hope you enjoy this adaptation.

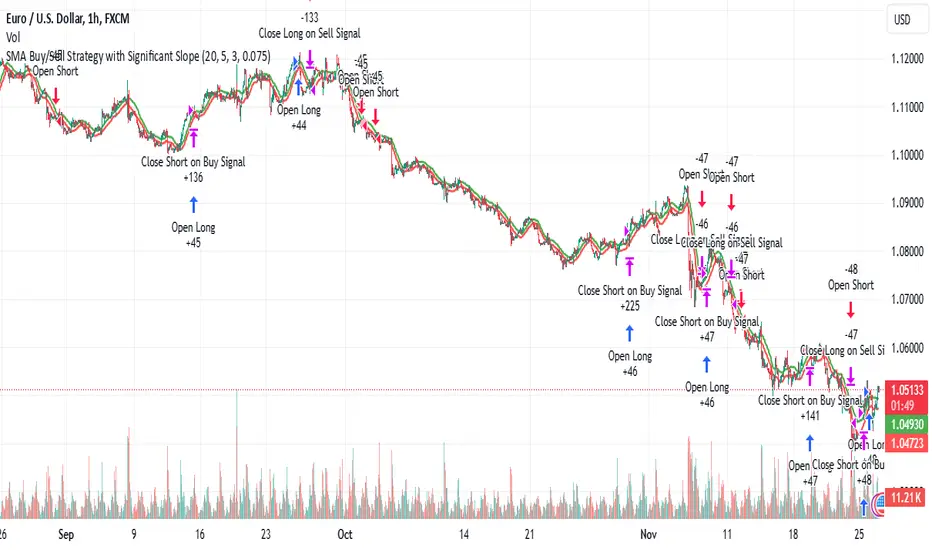
SMA Buy/Sell Strategy with Significant Slope and Dynamic TP/SLDescription:
This strategy uses a simple moving average (SMA) to detect trading opportunities based on the slope and proximity of price action. It ensures trades are only executed during significant trends, reducing false signals caused by sideways movements. The strategy incorporates dynamic risk management with an initial ambitious Take Profit (TP) and a Trailing Stop Loss (SL) to protect profits.
Key Features:
Trend Detection with SMA:
Two SMAs are calculated: one on High values and one on Low values.
Signals are generated when the price crosses these SMAs, ensuring:
Buy: Price closes above the SMA on High, with a significant upward slope.
Sell: Price closes below the SMA on Low, with a significant downward slope.
Slope Significance Check:
The slope of the SMA is calculated over a configurable period.
Only trends with a slope variation exceeding a user-defined percentage threshold are considered significant.
Dynamic Risk Management:
Ambitious Initial TP: Positions target a high percentage gain upon entry.
Trailing SL: Automatically adjusts as the price moves in favor of the trade, locking in profits.
Automatic Position Management:
Opposing signals close existing positions to avoid conflicting trades.
Configurable position size for risk control.
Parameters:
SMA Period: Number of candles for calculating the SMA.
Initial Take Profit (%): Percentage gain for the initial TP.
Trailing Stop Loss (%): Percentage for trailing SL based on the current price.
Slope Threshold (%): Minimum percentage change in SMA slope to confirm trend significance.
How It Works:
Buy Signal:
The price closes above the SMA on High values.
The slope of the SMA (on High) is positive and exceeds the slope threshold.
Sell Signal:
The price closes below the SMA on Low values.
The slope of the SMA (on Low) is negative and exceeds the slope threshold.
Exits:
A position closes at the Take Profit level, Trailing Stop Loss, or when an opposing signal is generated.
Use Case:
This strategy is ideal for trending markets where price action respects moving averages. It can be used on any timeframe or asset but is particularly effective in markets with clear directional movements.
Recommended Settings:
Timeframe: Works well on higher timeframes (e.g., 1H, 4H, Daily).
Slope Threshold (%): Default is 5%, adjust based on market volatility.
Initial TP and Trailing SL: Tailor to your risk/reward preferences.
By utilizing this strategy, traders can capitalize on significant market trends while dynamically managing risk. Test it on historical data to optimize the parameters for your preferred market!
McCrayTrendTraders often rely on price breaking above or below the 50-day moving average (50D-MA) as a buy/sell signal. However, this approach frequently results in false breakouts, especially during low-volatility periods when price compression precedes major moves. To address this issue, we use an 8-day exponential moving average (8D-EMA) to represent price and focus on the crossovers between the 8D-EMA and the 48D-EMA as entry/exit signals. This method reduces noise in low-volatility conditions, enables earlier trend entries, and helps traders stay in trends longer.
The indicator incorporates a 111-day EMA (111D-EMA) to define market bias:
• Above the 111D-EMA: Bias is long, favoring buying and selling into cash.
• Below the 111D-EMA: Bias is short, favoring selling and buying into cash.
An exception to this rule occurs when a bullish cross happens within 40% of the 200-week moving average (200W-MA), as these conditions historically signal optimal times to acquire BTC.
Signals:
Buy signals:
• A bullish cross while price is above the 111D-EMA.
• A bullish cross near the 200W-MA threshold (optional setting).
Sell signals:
• A bearish cross while price is below the 111D-EMA.
Exit signals:
• Both EMAs turn red (for long trades) or green (for short trades).
• The shading between the 111D-EMA and 200W-MA turns red (for longs) or green (for shorts), if enabled.
Reversal opportunities:
• A buy or sell label during an exit signal may indicate a reversal point, allowing traders to take profit and reopen positions in the opposite direction.
The methodology behind this indicator has generated 132% alpha since October 6, 2015. Special thanks to Anurag Parashar for refining the stylistic elements of the indicator.

SMA- Ashish SinghSMA
This script implements a Simple Moving Average (SMA) crossover strategy using three SMAs: 200-day, 50-day, and 20-day, with buy and sell signals triggered based on specific conditions involving these moving averages. The indicator is overlaid on the price chart, providing visual cues for potential buy and sell opportunities based on moving average crossovers.
Key Features:
Moving Averages:
The 200-day, 50-day, and 20-day SMAs are calculated and plotted on the price chart. These are key levels that traders use to assess trends.
The 200-day SMA represents the long-term trend, the 50-day SMA is used for medium-term trends, and the 20-day SMA is for short-term analysis.
Buy Signal:
A buy signal is triggered when the price is below all three moving averages (200 SMA, 50 SMA, 20 SMA) and the SMAs are in a specific downward trend (200 SMA > 50 SMA > 20 SMA). This is an indication of a potential upward reversal.
The buy signal is marked with a green triangle below the price bar.
Sell Signal:
A sell signal is triggered when the price is above all three moving averages and the SMAs are in a specific upward trend (200 SMA < 50 SMA < 20 SMA). This signals a potential downward reversal.
The sell signal is marked with a red triangle above the price bar.
Trade Information:
After a buy signal, the buy price, bar index, and timestamp are recorded. When a sell signal occurs, the percentage gain or loss is calculated along with the number of days between the buy and sell signals.
The script automatically displays a label on the chart showing the gain or loss percentage along with the number of days the trade lasted. Green labels represent gains, and red labels represent losses.
User-friendly Visuals:
The buy and sell signals are plotted as small triangles directly on the chart for easy identification.
Detailed trade information is provided with well-formatted labels to highlight the profit or loss after each trade.
How It Works:
This strategy helps traders to identify trend reversals by leveraging long-term and short-term moving averages.
A single buy or sell signal is triggered based on price movement relative to the SMAs and their order.
The tool is designed to help traders quickly spot buying and selling opportunities with clear visual indicators and gain/loss metrics.
This indicator is ideal for traders looking to implement a systematic SMA-based strategy with well-defined buy/sell points and automatic performance tracking for each trade.
Disclaimer: The information provided here is for educational and informational purposes only. It is not intended as financial advice or as a recommendation to buy or sell any stocks. Please conduct your own research or consult a financial advisor before making any investment decisions. ProfitLens does not guarantee the accuracy, completeness, or reliability of any information presented.

CMF and Scaled EFI OverlayCMF and Scaled EFI Overlay Indicator
Overview
The CMF and Scaled EFI Overlay indicator combines the Chaikin Money Flow (CMF) and a scaled version of the Elder Force Index (EFI) into a single chart. This allows traders to analyze both indicators simultaneously, facilitating better insights into market momentum and volume dynamics , specifically focusing on buying/selling pressure and momentum , without compromising the integrity of either indicator.
Purpose
Chaikin Money Flow (CMF): Measures buying and selling pressure by evaluating price and volume over a specified period. It indicates accumulation (buying pressure) when values are positive and distribution (selling pressure) when values are negative.
Elder Force Index (EFI): Combines price changes and volume to assess the momentum behind market moves. Positive values indicate upward momentum (prices rising with strong volume), while negative values indicate downward momentum (prices falling with strong volume).
By scaling the EFI to match the amplitude of the CMF, this indicator enables a direct comparison between pressure and momentum , preserving their shapes and zero crossings. Traders can observe the relationship between price movements, volume, and momentum more effectively, aiding in decision-making.
Understanding Pressure vs. Momentum
Chaikin Money Flow (CMF):
- Indicates the level of demand (buying pressure) or supply (selling pressure) in the market based on volume and price movements.
- Accumulation: When institutional or large investors are buying significant amounts of an asset, leading to an increase in buying pressure.
- Distribution: When these investors are selling off their holdings, increasing selling pressure.
Elder Force Index (EFI):
- Measures the strength and speed of price movements, indicating how forceful the current trend is.
- Positive Momentum: Prices are rising quickly, indicating a strong uptrend.
- Negative Momentum: Prices are falling rapidly, indicating a strong downtrend.
Understanding the difference between pressure and momentum is crucial. For example, a market may exhibit strong buying pressure (positive CMF) but weak momentum (low EFI), suggesting accumulation without significant price movement yet.
Features
Overlay of CMF and Scaled EFI: Both indicators are plotted on the same chart for easy comparison of pressure and momentum dynamics.
Customizable Parameters: Adjust lengths for CMF and EFI calculations and fine-tune the scaling factor for optimal alignment.
Preserved Indicator Integrity: The scaling method preserves the shape and zero crossings of the EFI, ensuring accurate analysis.
How It Works
CMF Calculation:
- Calculates the Money Flow Multiplier (MFM) and Money Flow Volume (MFV) to assess buying and selling pressure.
- CMF is computed by summing the MFV over the specified length and dividing by the sum of volume over the same period:
CMF = (Sum of MFV over n periods) / (Sum of Volume over n periods)
EFI Calculation:
- Calculates the EFI using the Exponential Moving Average (EMA) of the price change multiplied by volume:
EFI = EMA(n, Change in Close * Volume)
Scaling the EFI:
- The EFI is scaled by multiplying it with a user-defined scaling factor to match the CMF's amplitude.
Plotting:
- Both the CMF and the scaled EFI are plotted on the same chart.
- A zero line is included for reference, aiding in identifying crossovers and divergences.
Indicator Settings
Inputs
CMF Length (`cmf_length`):
- Default: 20
- Description: The number of periods over which the CMF is calculated. A higher value smooths the indicator but may delay signals.
EFI Length (`efi_length`):
- Default: 13
- Description: The EMA length for the EFI calculation. Adjusting this value affects the sensitivity of the EFI to price changes.
EFI Scaling Factor (`efi_scaling_factor`):
- Default: 0.000001
- Description: A constant used to scale the EFI to match the CMF's amplitude. Fine-tuning this value ensures the indicators align visually.
How to Adjust the EFI Scaling Factor
Start with the Default Value:
- Begin with the default scaling factor of `0.000001`.
Visual Inspection:
- Observe the plotted indicators. If the EFI appears too large or small compared to the CMF, proceed to adjust the scaling factor.
Fine-Tune the Scaling Factor:
- Increase or decrease the scaling factor incrementally (e.g., `0.000005`, `0.00001`, `0.00005`) until the amplitudes of the CMF and EFI visually align.
- The optimal scaling factor may vary depending on the asset and timeframe.
Verify Alignment:
- Ensure that the scaled EFI preserves the shape and zero crossings of the original EFI.
- Overlay the original EFI (if desired) to confirm alignment.
How to Use the Indicator
Analyze Buying/Selling Pressure and Momentum:
- Positive CMF (>0): Indicates accumulation (buying pressure).
- Negative CMF (<0): Indicates distribution (selling pressure).
- Positive EFI: Indicates positive momentum (prices rising with strong volume).
- Negative EFI: Indicates negative momentum (prices falling with strong volume).
Look for Indicator Alignment:
- Both CMF and EFI Positive:
- Suggests strong bullish conditions with both buying pressure and upward momentum.
- Both CMF and EFI Negative:
- Indicates strong bearish conditions with selling pressure and downward momentum.
Identify Divergences:
- CMF Positive, EFI Negative:
- Buying pressure exists, but momentum is negative; potential for a bullish reversal if momentum shifts.
- CMF Negative, EFI Positive:
- Selling pressure exists despite rising prices; caution advised as it may indicate a potential bearish reversal.
Confirm Signals with Other Analysis:
- Use this indicator in conjunction with other technical analysis tools (e.g., trend lines, support/resistance levels) to confirm trading decisions.
Example Usage
Scenario 1: Bullish Alignment
- CMF Positive: Indicates accumulation (buying pressure).
- EFI Positive and Increasing: Shows strengthening upward momentum.
- Interpretation:
- Strong bullish signal suggesting that buyers are active, and the price is likely to continue rising.
- Action:
- Consider entering a long position or adding to existing ones.
Scenario 2: Bearish Divergence
- CMF Negative: Indicates distribution (selling pressure).
- EFI Positive but Decreasing: Momentum is positive but weakening.
- Interpretation:
- Potential bearish reversal; price may be rising but underlying selling pressure suggests caution.
- Action:
- Be cautious with long positions; consider tightening stop-losses or preparing for a possible trend reversal.
Tips
Adjust for Different Assets:
- The optimal scaling factor may differ across assets due to varying price and volume characteristics.
- Always adjust the scaling factor when analyzing a new asset.
Monitor Indicator Crossovers:
- Crossings above or below the zero line can signal potential trend changes.
Watch for Divergences:
- Divergences between the CMF and EFI can provide early warning signs of trend reversals.
Combine with Other Indicators:
- Enhance your analysis by combining this overlay with other indicators like moving averages, RSI, or Ichimoku Cloud.
Limitations
Scaling Factor Sensitivity:
- An incorrect scaling factor may misalign the indicators, leading to inaccurate interpretations.
- Regular adjustments may be necessary when switching between different assets or timeframes.
Not a Standalone Indicator:
- Should be used as part of a comprehensive trading strategy.
- Always consider other market factors and indicators before making trading decisions.
Disclaimer
No Guarantee of Performance:
- Past performance is not indicative of future results.
- Trading involves risk, and losses can exceed deposits.
Use at Your Own Risk:
- This indicator is provided for educational purposes.
- The author is not responsible for any financial losses incurred while using this indicator.
Code Summary
//@version=5
indicator(title="CMF and Scaled EFI Overlay", shorttitle="CMF & Scaled EFI", overlay=false)
cmf_length = input.int(20, minval=1, title="CMF Length")
efi_length = input.int(13, minval=1, title="EFI Length")
efi_scaling_factor = input.float(0.000001, title="EFI Scaling Factor", minval=0.0, step=0.000001)
// --- CMF Calculation ---
ad = high != low ? ((2 * close - low - high) / (high - low)) * volume : 0
mf = math.sum(ad, cmf_length) / math.sum(volume, cmf_length)
// --- EFI Calculation ---
efi_raw = ta.ema(ta.change(close) * volume, efi_length)
// --- Scale EFI ---
efi_scaled = efi_raw * efi_scaling_factor
// --- Plotting ---
plot(mf, color=color.green, title="CMF", linewidth=2)
plot(efi_scaled, color=color.red, title="EFI (Scaled)", linewidth=2)
hline(0, color=color.gray, title="Zero Line", linestyle=hline.style_dashed)
- Lines 4-6: Define input parameters for CMF length, EFI length, and EFI scaling factor.
- Lines 9-11: Calculate the CMF.
- Lines 14-16: Calculate the EFI.
- Line 19: Scale the EFI by the scaling factor.
- Lines 22-24: Plot the CMF, scaled EFI, and zero line.
Feedback and Support
Suggestions: If you have ideas for improvements or additional features, please share your feedback.
Support: For assistance or questions regarding this indicator, feel free to contact the author through TradingView.
---
By combining the CMF and scaled EFI into a single overlay, this indicator provides a powerful tool for traders to analyze market dynamics more comprehensively. Adjust the parameters to suit your trading style, and always practice sound risk management.

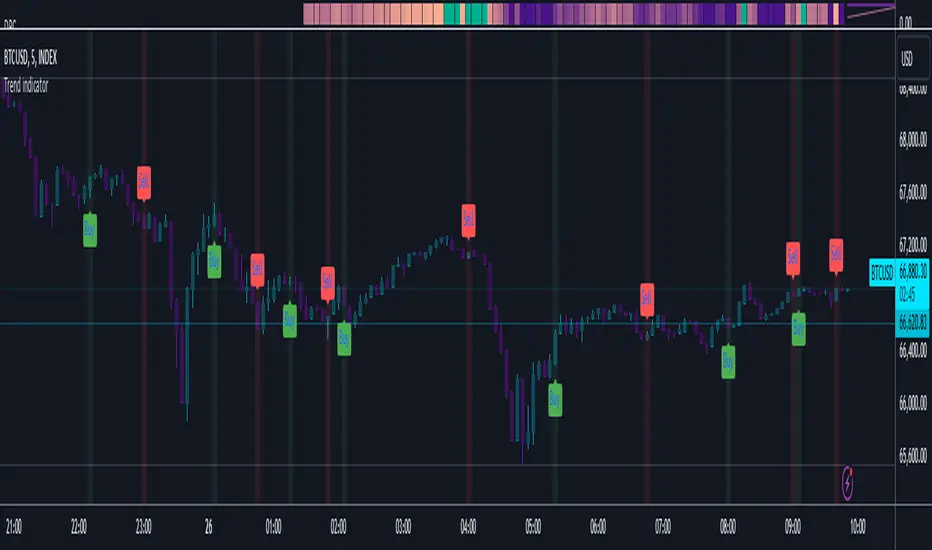
Trend indicatorThe Trend Indicator script is a custom oscillator-based tool designed for identifying potential entry and exit points in the market. Using a combination of Exponential Moving Average (EMA) and Relative Moving Average (RMA) calculations, it captures the trend direction and signals market momentum shifts. The indicator visually presents buy and sell signals and color-codes background conditions based on potential trend reversals, offering a clear and structured approach for trend-based trading strategies.
Key Components
1. User Inputs
Smoothing Length (smoothLength): The script allows the trader to input a smoothing length for adjusting the EMA and RMA calculations. This parameter fine-tunes the indicator's sensitivity to price movements, where lower values result in a more responsive oscillator, while higher values make it smoother and less reactive to minor fluctuations.
Source (source): This is the price data input for the script, defaulting to the close price but customizable to other price points (e.g., open, high, or low) based on user preference.
2. Smoothed Price Calculation
Using an Exponential Moving Average (EMA), the script smooths the selected source price to reduce noise and make trends clearer. The EMA’s calculation length is determined by the smoothLength input, and this moving average forms the baseline from which other components derive.
3. Oscillator Calculation
The oscillator value represents the relative strength or weakness of price momentum. Here, the oscillator is computed using Relative Moving Average (RMA), applied to the difference between the smoothed price and the SMA of the source price. The RMA further filters short-term fluctuations to identify the core trend direction.
This oscillator measures the divergence between the smoothed price and the SMA, providing insight into whether the market is experiencing bullish or bearish pressure.
4. Signal Line
The Signal Line is a Simple Moving Average (SMA) of the oscillator, using the same smoothLength parameter. The SMA smooths the oscillator’s values, offering a secondary reference that traders can use to identify changes in momentum when it crosses the oscillator line.
5. Buy and Sell Signals
Buy Signal (bullSignal): The script triggers a buy signal when the oscillator crosses above zero. This indicates that momentum may be shifting in favor of buyers, potentially signaling an uptrend.
Sell Signal (bearSignal): The script triggers a sell signal when the oscillator crosses below zero, suggesting a shift in momentum to the downside, potentially initiating a downtrend.
Visualization
1. Plotting the Oscillator and Signal Line
The oscillator line is plotted in blue, representing the current momentum of the price. The signal line, plotted in red, serves as a smoother baseline.
When the oscillator crosses the signal line, it hints at a potential trend shift, which can be a signal for cautious traders to pay attention to trend reversals.
2. Buy/Sell Signal Markers
Buy Signal Marker: A green label appears below the bar whenever the oscillator crosses above zero, indicating a potential buying opportunity.
Sell Signal Marker: A red label appears above the bar whenever the oscillator crosses below zero, marking a potential selling opportunity.
These visual cues make it easy for traders to spot signals directly on the chart without needing to watch the oscillator values closely.
3. Background Coloring for Trend Direction
To further aid in trend identification, the background color changes to green when a bullish signal is active and red during bearish signals. This coloring helps visually reinforce the current trend direction, allowing traders to spot prolonged uptrends or downtrends easily.
Trading Strategy Suggestions
This indicator can be adapted to various trading strategies. Here are a few practical suggestions:
Trend-Following Strategy:
When the oscillator crosses above zero (green background), it could indicate the start of a potential uptrend. Consider entering a long position on this signal and holding it until the oscillator crosses back below zero.
Conversely, a cross below zero (red background) may signal a downtrend, making it suitable for short positions or exiting long trades.
Cross-Confirmation with Signal Line:
Use the crossover of the oscillator and signal line to confirm trends. For example, when the oscillator is above zero and crosses above the signal line, it could reinforce a strong buy signal. Similarly, a cross below the signal line when the oscillator is below zero could strengthen a sell signal.
Combining with Other Indicators:
For added accuracy, combine this indicator with other trend-confirming tools like Moving Averages or Bollinger Bands to confirm the validity of buy/sell signals.
Risk Management:
Always set stop-losses below recent lows in uptrends or above recent highs in downtrends. This indicator is useful for entry and exit points but should always be paired with solid risk management practices.
The Trend Indicator is a comprehensive tool for identifying market momentum and potential reversal points. By smoothing out price data and using an oscillator to track momentum shifts, it offers traders a structured approach to trading trends. Its built-in buy/sell markers and background coloring make it visually accessible and easy to interpret at a glance. However, as with any indicator, it's most effective when combined with other strategies and a disciplined approach to risk management.
UtilityLibrary "Utility"
A utility library for various trading tools such as signal generation, custom indicators, and multi-condition crossovers.
multiCrossover(source1, source2, threshold1, threshold2)
multiCrossover
@description Detects multi-condition crossovers between two sources with threshold filters.
Parameters:
source1 (float) : The first data series to compare.
source2 (float) : The second data series to compare.
threshold1 (float) : A value that source1 must exceed to trigger the crossover.
threshold2 (float) : A value that source2 must exceed to trigger the crossunder.
Returns: A tuple: (crossUp, crossDown) where crossUp is a boolean for upward crossover, and crossDown is for downward crossover.
macdCustom(source, fastLength, slowLength, signalLength, macdThresh)
macdCustom
@description Calculates custom MACD signals based on thresholds.
Parameters:
source (float) : The price data or input series.
fastLength (simple int) : The length of the fast EMA.
slowLength (simple int) : The length of the slow EMA.
signalLength (simple int) : The signal line length.
macdThresh (float) : A threshold for the MACD line to confirm buy/sell signals.
Returns: A tuple: (macdBuySignal, macdSellSignal) where macdBuySignal is true when MACD crosses above, and macdSellSignal is true when MACD crosses below the signal line.
combinedMacdRsi(source, fastLength, slowLength, signalLength, rsiLength, macdThresh, rsiThresh)
combinedMacdRsi
@description Generates combined signals from MACD and RSI indicators.
Parameters:
source (float) : The price data or input series.
fastLength (simple int) : The length of the fast EMA for MACD.
slowLength (simple int) : The length of the slow EMA for MACD.
signalLength (simple int) : The signal line length for MACD.
rsiLength (simple int) : The length of the RSI calculation.
macdThresh (float) : The threshold for MACD signals.
rsiThresh (float) : The threshold for RSI signals.
Returns: A tuple: (buySignal, sellSignal) where buySignal is generated when MACD is positive and RSI is below the threshold, and sellSignal when MACD is negative and RSI is above the threshold.
movingAverageCrossover(source, shortLength, longLength)
movingAverageCrossover
@description Detects crossovers between short-term and long-term moving averages.
Parameters:
source (float) : The price data or input series.
shortLength (int) : The length of the short-term moving average.
longLength (int) : The length of the long-term moving average.
Returns: A tuple: (crossUp, crossDown) where crossUp is true when the short-term MA crosses above the long-term MA, and crossDown when the reverse occurs.
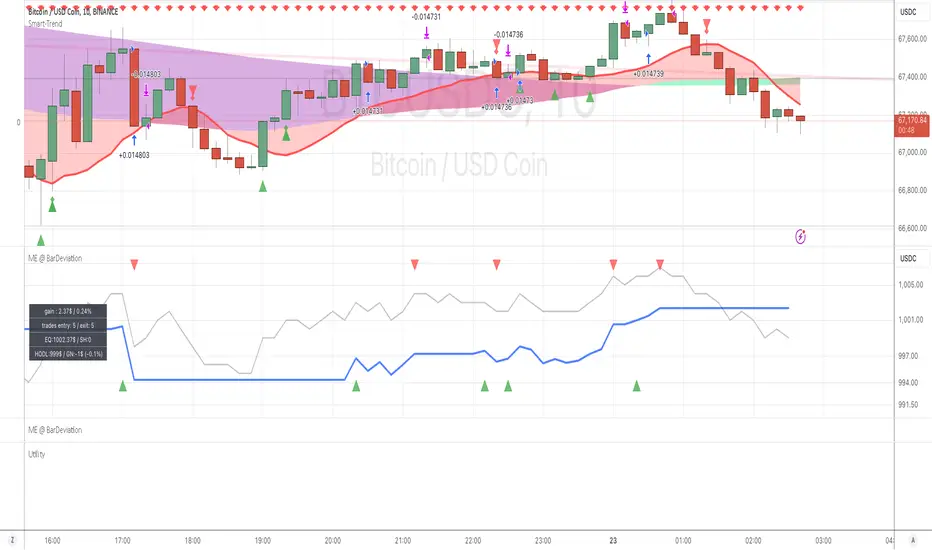
Cumulative Volume Delta Strategy | Flux Charts💎 GENERAL OVERVIEW
Introducing the Cumulative Volume Delta Strategy (CVDS) Indicator, an advanced tool designed to enhance trading strategies by identifying potential trend reversals through volume dynamics. This script features integrated order block detection, Fair Value Gaps (FVGs), and a dynamic take-profit (TP) and stop-loss (SL) system. For an in-depth understanding of the strategy, refer to the "HOW DOES IT WORK?" section below.
Features of the new Cumulative Volume Delta Strategy (CVDS) Indicator :
Cumulative Volume Delta-based Strategy
Order Block and Fair Value Gap (FVG) Entry Methods
Dynamic TP/SL System
Customizable Risk Management Settings
Alerts for Buy, Sell, TP, and SL Signals
📌 HOW DOES IT WORK ?
The CVDS indicator operates by tracking the net volume difference between buyers and sellers to identify divergences that could indicate potential trend reversals. A cumulative volume delta (CVD) calculation is employed to measure the intensity of these divergences in relation to price movements. The net volume sum is reset every trading day (can be changed from the settings using the anchor period option), and divergences are detected when the cumulative volume crosses the 0-line over or under.
Once a significant divergence is detected, the indicator identifies breakout points, confirmed by either Fair Value Gaps (FVGs) or Order Blocks (OBs). Depending on your chosen entry mode, the indicator will trigger a buy or sell entry when the confirmation signal aligns with the breakout direction. Alerts for Buy, Sell, Take-Profit, and Stop-Loss are available.
Note that the indicator cannot run on 1-minute and 1-second charts, as it needs to get data from a lower timeframe. 1-minutes & 1-second timeframes are the minimum timeframes in their ranges respectively.
🚩 UNIQUENESS
What sets this indicator apart is the combination of volume divergence analysis with advanced price action tools like Fair Value Gaps (FVGs) and Order Blocks (OBs). The ability to choose between these methods, along with a dynamic TP/SL system that adapts based on volatility, provides flexibility for traders in any market condition. The backtesting dashboard provides metrics about the performance of the indicator. You can use it to tune the settings for best use in the current ticker. The CVD-based strategy ensures that trades are initiated only when meaningful divergences between volume and price occur, filtering out noise and increasing the likelihood of profitable trades.
⚙️ SETTINGS
1. General Configuration
Anchor Period: Time anchor period used in CVD calculation. This is essentially the period that the volume delta sum will be reset. Lower timeframes may result in more entries at the cost of less reliable results.
Entry Mode: Choose between FVGs or OBs to trigger your entries based on the confirmation signals.
Retracement Requirement: Enable to confirm the entry after a retracement toward the FVG or OB.
2. Fair Value Gaps
FVG Sensitivity: Modify the sensitivity of FVG detection, allowing for more or fewer gaps to be considered valid.
3. Order Blocks (OB)
Swing Length: Define the swing length to identify OB formations. Shorter lengths find smaller OBs, while longer lengths detect larger structures.
4. TP / SL
TP / SL Method:
a) Dynamic: The TP / SL zones will be auto-determined by the algorithm based on the Average True Range (ATR) of the current ticker.
b) Fixed : You can adjust the exact TP / SL ratios from the settings below.
Dynamic Risk: The risk you're willing to take if "Dynamic" TP / SL Method is selected. Higher risk usually means a better winrate at the cost of losing more if the strategy fails. This setting is has a crucial effect on the performance of the indicator, as different tickers may have different volatility so the indicator may have increased performance when this setting is correctly adjusted.
